Programming Volume Controls
Notice to Programmers of Audio Software and Hardware
There is a single very annoying thing about lots of audio software products, due to either lack of programmers' knowledge about the human auditory system, laziness, or both. Their volume controls are a pain to work with. If you could ever be involved—even only remotely—in the development of a software or hardware product involving sound, please read this text carefully, burn its core message into your memory and spread the news!
A Chinese translation of this page is available. 还提供该网页的中文翻译。
To the Point
For those with little time, here is the essence of this text compressed into a few sentences:
- Volume sliders must not be linear. Linear volume sliders are a nuisance because human perception of loudness is not linear at all, it is logarithmic. That is why all audio equipment worth its name uses the dB scale to indicate volume and gain settings. For a relative amplitude level x, the dB value equals 20*log10(x). Positive dB values mean amplification, negative values attenuation. Multiplying amplitude by a certain factor means adding a certain amount of dB. To measure absolute loudness as perceived by humans, the dB(A) scale is often used, with 0 dB(A) the loudness of the most silent perceivable sound. In practice, a ‘silent’ room will be at ±30 dB(A).
- A volume control should not be based on percentages, because this implies linearity. A percentage is only acceptable if it maps to a range of dB values, for instance 0% = -60 dB and 100% = 0 dB.
- The ideal volume slider follows an exponential curve y = a·exp(b·x), with its lowest setting corresponding to ‘silence’ (typically 30 dB(A) for consumer products) and its highest setting the maximum loudness the user's audio equipment produces. The problem with this is that one can in general only make vague assumptions about what equipment the user will be using. Unless you are working on a high-end product with known specifications, you will need to make some guesses and approximations. A sensible assumption for consumer equipment is that it will have a usable range of 60 dB.
- Table 1 shows some practical values of parameters a and b in the formula y = a·exp(b·x) for various figures of loudness ranges; x is the slider's relative position and y is the actual scale factor for the sound waveform, if both these values are within the interval [0, 1]. Again, you should probably use the parameters for 60 dB range. Add a linear roll-off near zero if you want to ensure perfect silence at volume setting 0.
- When offering a way to change volume by discrete increments, like pushing buttons or turning a mouse scroll wheel, make sure the increments are somewhere between 1 dB and 3 dB. Volume changes below 1 dB are not noticeable and changes above 3 dB are too coarse. 2 dB is pretty much ideal as step size; 3 dB is also OK if fine control is not needed.
- If for some reason you do not want to implement a full exponential function, you can instead rely on a good all-round and computationally cheap approximation that fits the typical 60 dB range of low-to-medium powered consumer audio systems. This approximation is the 4th power of the volume slider's position x scaled to the interval [0, 1]. In other words: amplitude multiplication factor = x4. Table 1 shows similar approximations for other dynamic ranges. If you cannot afford implementing a true exponential curve, use this simple formula for your volume slider. It is not perfect, but a billion times better than a linear slider!
If you want to know more, read on. Otherwise, read the above list again and make sure you'll never forget it. You may also want to try out the demo.
Note that in this text, both the middle dot · and the asterisk * may represent the multiplication operator. The log() function without a base suffix represents the natural logarithm.
Why Linear Volume Controls are Evil
Most audio software nowadays has sliders or even rotating knobs to control the volume. The intention is to mimic controls of ‘classic’ audio hardware. Unfortunately, there is one thing about a lot of software sliders which makes them terribly annoying: they are LINEAR. You might ask, what could possibly be wrong with a linear slider: it is zero at the one end, 100% at the other end, and neatly linear in between, isn't that just ideal? The answer is a big no.
Give it a try: open your favourite audio player, start playing a song, grab the volume slider, and wobble it to and fro at the ‘loud’ end of the volume range. Next, do the same at the ‘silent’ end. Chances are you will experience the following: almost no audible volume variations at the ‘loud’ end, and extreme volume variations at the ‘silent’ end. In that case you can be pretty sure the slider is linear.
Using a linear volume control can lead to these symptoms:
- The most silent volume setting, the first step above mute, is already too loud.
- The perceived maximum volume level is reached around the middle of the slider, making the upper half useless.
- When connecting earphones with a high sensitivity versus PC speakers with low output to the same computer, it is difficult or impossible to make fine volume adjustments with the earphones, while the slider needs to be hauled over great distances to cause any loudness change on the speakers.
Issues like these ultimately lead to frustrated people cursing the damn volume control, or feeling uneasy while using your product without really knowing why. Luckily there are lots of products with correct volume controls, but the number of flawed products is way too high.
A few popular applications that I have found to suffer from this flaw in the present and the past, are:
- YouTube and pretty much every web video player(1),
- Windows Media Player and the Windows volume control,
- QuickTime Player,
- older versions of iTunes.
Microsoft is probably aware of how bad the Windows volume control is, but they are unlikely to fix it because they are pretty much obliged to remain bug-compatible due to their market share.
The evil has even spread to hardware. The solderable graphic equaliser kit K4302 from Velleman had linear sliders when I bought it back in 1995. I don't know if this has been corrected now (if the kit still exists at all), but the sliders should be logarithmic (C law if I'm correct). Even the G3 iMac's volume control was linear, and I'm afraid this is just one of many examples.
What is going wrong?
Now what exactly is wrong with a linear volume slider? The answer lies within the way our ears perceive sound. The point is that our sensation of ‘loudness’ is LOGARITHMIC.
This means that we are much more sensitive to small variations in amplitude for silent sounds than for loud sounds. This allows us to cope with a very large dynamic range of amplitudes. It also means a linear volume slider causes a logarithmic sensation of volume variations, and that just doesn't feel right.
The above figure shows a logarithmic curve. Two identical sections are marked on the horizontal axis which depicts a bad volume slider. The vertical axis shows perceived volume changes. The corresponding section marked by the curve at the ‘silent’ end is much larger than at the ‘loud’ end.
The solution to implementing a good volume slider is fairly simple: instead of being linear, the slider should be EXPONENTIAL. Because log(exp(x)) = x, the sensation of volume variations will be linear, and that is what we want(2).
Some important assumptions and conventions used in this text:
- Both the volume slider and the audio system work with values between zero (0, minimum) and one (1, maximum). Stated otherwise, they are in the interval [0, 1].
- The volume slider position is represented by x.
- The resulting multiplication factor for signed numeric sound wave amplitude values, in other words the “volume” as set in the application, is represented by y.
Finding the ‘ideal’ curve
Exponential functions have two annoying properties. The first is that they only reach zero at minus infinity. This is not a problem however, because our ears do not have infinite sensitivity. We only need to know the practical dynamic range, this will be explained below.
The second is that in its most general form y = a·exp(b·x)+c, an exponential function going through two points can have various shapes. Even a linear function is a limit case of such a curve. Luckily in the case of our volume control, our ears do not have an offset, hence we can and should omit the term c, and we only need the typical exponential function:
y = a·exp(b·x)
This means that two points suffice to obtain a unique solution for the constants a and b. We already know one of those points, because we want the function to have a value of 1 for x = 1. This means that a = 1/exp(b) or b = log(1/a).
So, the problem is reduced to determining the correct value of b, which controls the shape of the curve. Small values produce a very ‘sharp’ curve while large values produce a more linear-like curve.
If you are still thinking linearly, you might be tempted to pick {0, 0} as the second point, which it is not. As I said above, our exponential volume control will inevitably still have a non-zero amplitude at the zero slider position. This is not a problem because the logarithmic response curve of our ears also hits zero below a certain non-zero input loudness, the hearing threshold. Moreover, in any normal environment with background noise, sounds with a loudness below the noise level will already be inaudible.
The major problem is that even though the hearing threshold is roughly the same across different persons with normal hearing, the loudness produced by any audio system for a given signal amplitude depends on a multitude of parameters. To determine the correct value for b, we need more information. If we want to provide the user with a “fully linear volume control sensation,” we would need to know how ‘loud’ their audio equipment plays at its loudest setting. Obviously, this is not a practical question. There simply is no specific answer to it unless you are developing software for very specific audio hardware. We will need to make some assumptions. First a short digression about how sound ‘loudness’ is measured.
Measuring sound levels
I explain this in more detail on another page, but here is a summary.
Because the human auditory system has a logarithmic sensitivity curve, a special unit of ‘sound loudness’ was invented and named after Graham Bell: the ‘Bel.’ This unit is too large to be practical however, therefore it is almost always used with a factor 0.1, yielding the decibel, denoted with the symbol dB: 1 Bel = 10 dB. There are two kinds of dB scales, an absolute and a relative scale.
The absolute scale tries to give an indication of how loud a certain sound is perceived by an average human listener, aka the “sound pressure level” (SPL). There are some variations on this scale, but the most widely used one is “dB(A)”. To determine the dB(A) value for a certain sound, the sound has to be filtered through a filter corresponding to the frequency response curve of an “average human.” Next, the 10-base logarithm of the power is taken and the result is multiplied by 10. I will not go into more detail on this because it is not of much use here. What you should know is that the most silent audible volume level (the hearing threshold) corresponds to 0 dB(A). In practice, people will already perceive 30 dB(A) as silence because that is about the background noise level in many ‘silent’ environments. Being in an environment with 0 dB(A) is actually a weird experience. The loudest volume level, the ‘pain threshold,’ is about 120 dB(A). A classical orchestra can produce about 94 dB(A). Note that because of the logarithm, multiplying the power of a sound by a factor of 10 means adding 10 to the dB(A) value.
The relative scale is used for all kinds of physical quantities, and indicates the relative amplitude of a signal compared to another. The symbol is simply ‘dB’. The calculation of the dB value depends on whether one is working with amplitudes or power values.
- For a ratio P between two power values, the formula is 10·log10(P).
- For the ratio A between two amplitudes, the formula is 20·log10(A).
The reason for the difference between these formulas, is that power is proportional to amplitude squared, and the square (raising to the power 2) becomes a factor 2 after taking the logarithm. In this text we are working with amplitudes, hence we need the latter formula.
Theoretically, the absolute and relative scales cannot be readily interchanged. When taking a sound of 90 dB(A) and attenuating it to −20 dB, there is no guarantee at all that it will be perceived exactly as 70 dB(A). But in practice it will be an OK approximation, therefore in this text I consider the scales as compatible.
Finding the ideal curve, part 2
Now we know more about the dB scale, we can go back to our problem of determining a good b value in the formula y = a·exp(b·x). Remember, y represents the linear volume and x the slider position, both scaled to the interval [0, 1].
We should make sure the curve we end up with, results in a near linear loudness experience with the listener. To start with, there is little to no point in going below 30 dB(A) because background noise in any realistic environment will be around that level. Hence we should consider 30 dB(A) as the threshold instead of 0 dB(A).
Now let us assume that the maximum loudness that can be produced by the user's equipment is 90 dB(A). This is quite loud already and people will generally not want to expose themselves to more than 90 dB(A) for a prolonged period anyway. Built-in speakers in PCs and laptops may not even be able to reach this level, but earphones and headphones as well as Hi-Fi or PA systems can easily exceed it.
We now know two points of our y = a·exp(b·x) curve, namely: {0, 30dB(A)} and {1, 90dB(A)}.
If we move to relative units and follow the usual convention for attenuation levels where 0dB is the loudest our system can go, this translates to respectively {0, −60dB} and {1, 0dB}.
If we offset this by 60 dB, we get {0, 0dB} and {1, 60dB}, making our calculations somewhat more intuitive.
Given that we work with amplitudes, 60 dB is 1060/20 = 1000 times the amplitude of 0 dB. Hence 1000 = exp(b·1) and b = log(1000) = 6.908.
Using the relation between a and b derived earlier, the value of a is simply 1/1000.
Therefore for this particular scenario, the amplitude factor versus relative slider position would be described by the formula y = exp(6.908·x)/1000.
Now we have a practical curve which should produce an agreeable result in most situations. Theoretically, the lowest position on the slider should correspond to 30 dB(A), the level at which sound becomes masked by background noise. Although this means there is no real need to force the output to zero, in practice this is desirable because people expect absolute silence at the zero setting, and this is not guaranteed with all our guesswork. There are a few solutions to achieve this. Simplest is to just force the lowest position to silence:
if(x == 0) ampl = 0;A smoother transition to zero that is very easy to implement:
if(x < .1) ampl *= x*10;This is not practical however if you need to be able to set the slider position for a given volume, because solving for x in equations containing x·exp(x) is not trivial. In this case it is better to make the roll-off entirely linear (obviously the constant multiplication factor at the right would be precomputed):
if(x < .1) ampl = x*10 * a*exp(0.1*b);
An alternative way to make the curve go through {0, 0}, is to shift it down as a whole and increase its range accordingly. This means using the complete formula with offset a·exp(b·x)+c after all, with c = -a and b = log(1+1/a).
Which of these solutions to use, depends on how much extra complexity you are willing to introduce. My favourite is the fully linear roll-off.
Table 1 shows values for a and b for various dynamic ranges (i.e., the difference between the maximum loudness and background noise level), giving the ‘ideal’ response curve for a volume control whose position is described by a number in the interval [0, 1]. If you can afford implementing the exponential function in your software/hardware, by all means use this formula. If you do not know for sure what the actual maximum loudness is that the consumer's hardware can produce with the volume control at position 1, try to make an educated guess. 90 dB(A) with a background noise level of 30 dB(A) hence a useful dynamic range of 60 dB, is probably a good guess. It will never be exact anyway because the dB(A) value also depends on the kind of sound being played. Yet, even a curve with parameters for a max dB(A) that is off by quite a bit, will still be much better than a silly linear curve especially when using the smooth roll-off to zero as described above.
| Dynamic range | a | b | Approximation |
|---|---|---|---|
| 50 dB | 3.1623e-3 | 5.757 | x3 |
| 60 dB | 1e-3 | 6.908 | x4 |
| 70 dB | 3.1623e-4 | 8.059 | x5 |
| 80 dB | 1e-4 | 9.210 | x6 |
| 90 dB | 3.1623e-5 | 10.36 | x6 |
| 100 dB | 1e-5 | 11.51 | x7 |
Finding the not-so-ideal-but-still-quite-good curve
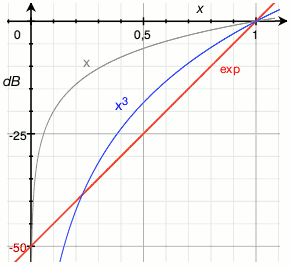
Some programmers may not like including an entire math library just to make a good volume slider with an exponential function, especially on constrained embedded devices. Luckily there is an alternative which sufficiently approximates an exponential curve, is much cheaper, and reaches zero at 0 automatically. The graph at the right shows three curves: the linear curve (yuck), the 60 dB exponential curve (red), and the curve of the function x4 (blue). As you can see, the blue curve lies pretty close to the red curve, and you can also see how monstrously the linear curve deviates. The fourth power-function demands only three multiplications (or two at the cost of an extra line of code) and it starts from zero, what more could one want?
I tried the x4 curve in some experiments and for most volume settings it has a very natural ‘feel.’ Depending on your personal taste you may find x3 or x5 an even better approximation. Keep in mind that in situations where the maximum volume is rather quiet, you may need a less ‘strong’ curve like x3, and a ‘stronger’ curve if the maximum volume is really loud. For a dynamic range of 90 dB, x6 is a good approximation but only few systems would need that kind of range.
The last column of Table 1 shows reasonable approximations of the form xn for each dynamic range value. The series of graphs below shows how well those approximations correspond to the ideal curves when plotted in a dB (logarithmic) scale. Hover over or touch the numbers to change the graph. You will see that the approximation is worst at the lowest slider settings: because the volume quickly drops to zero (= minus infinity on the dB scale), the actual usable range of the volume slider is slightly reduced. That is a small price to pay for an otherwise much more balanced response than a simple linear curve, especially if you see how awfully the latter deviates (x in the graphs). The formula x7 remains a good approximation up to a dynamic range of 120 dB, but you should not be making equipment that exposes the user to an average above 100 dB(A) anyway, lest you want to attract lawsuits for damaged hearing.
In general I still recommend implementing a true exponential (logarithmic) volume control whenever possible, but the xn approximation is a good alternative when one just wants to implement a decent volume control with minimal effort.
Notes
If you are going to use a discrete volume control instead of a slider, that is increased or decreased in steps by pressing an ‘up’ and ‘down’ button, be aware that the smallest difference in volume that humans can perceive is about 1 dB, or 10%. Actually this also counts for many other perceptions like the size of an object or speed. Hence it is useless to make your increments smaller than 10%, but don't make them too large either or your volume control will be too coarse. A good step size is 2 dB, you should not exceed 3 dB. One version of the Gnome volume control widget had 5 dB steps when using the scroll wheel or volume keys. This is too large, and the web is full of complaints about it, but at the time of this writing it has not been fixed—only made worse by replacing the fixed step size with a quadratic function.
I sometimes get mails from people who want to know how they should configure a hardware or software volume control that already uses dB values by design. Some seem to believe they still need to apply a non-linear transformation to the dB values. No! The only things you need to determine there, are the range you want to use and the step size if applicable. For instance if the volume control offers a range of 120 dB, most likely you will want to limit it to the upper 60 dB range. Some controls offer attenuation (negative dB values) as well as amplification (positive dB values), you need to determine if your application needs either or both.
Some people have half-baked knowledge about sound perception being logarithmic, which causes them to make shoddy reasonings like the following. A sound of 98 dB(A) is annoyingly loud, but if we can reduce it to 95 dB(A), it is only half the power, therefore only half as annoying!
Right and wrong. The power is indeed halved (and the amplitude reduced to a fraction 0.71), but the perceived loudness is only 3 dB lower. Since a 1 dB difference is at the limit of being unnoticeable, 3 dB is only a tad above barely noticeable. 95 dB(A) is still mighty loud and unless other characteristics of the sound have changed, it will be only slightly less annoying than at 98 dB(A). The same reasoning is often applied to hearing damage, which is equally wrong because the relation between loudness and hearing damage is not linear as well.
Remember that all this does not only apply to sliders. It also applies to menus with volume presets and rotating knobs (although these are quite rare in software, but all potentiometers of decent audio equipment approximate an exponential characteristic). It also counts for equalisers, because these are volume controls in their own right, even if they only control a part of the frequency spectrum.
After reading this text it should be clear that implementing volume controls is not exact science except in well-controlled situations. However, the core message you should take home is: volume must be exponential, or at least look like it!
Interactive Demo
Don't just take my word for it, try it out yourself! Below is a HTML audio player and 3 sliders that control its playback volume: a linear slider, a logarithmic / exponential one with 60 dB range and linear roll-off, and one using the x4 approximation. The sliders are linked, such that you can see how their positions correspond.
Try dragging the linear slider while looking at the logarithmic slider, and you will have a visual representation of what is wrong with many volume controls in present-day software.
Below the sliders is a discrete volume control with 2 dB step size.
For this demo to work well, set your device's global volume control to the loudest you would consider acceptable.
(Note that the HTML player may have its own volume control, which of course is likely to be linear.)
To recap, this demo should illustrate that:
- the linear control is annoying and only starts to have a significant effect in its leftmost region (if this slider still seems vaguely usable, it is only thanks to its rather large size);
- controlling or indicating volume using percentages makes no sense, 50% does not sound like half as loud at all;
- the logarithmic (exponential) slider is the most usable if its dB range is appropriate for the situation;
- the x4 slider is pretty decent, but its lowest settings reach silence a bit too soon;
- discrete steps of 2 dB offer a fine-grained control without requiring too many button presses.
Example Files
If for some reason the demo doesn't work or is not practical for demonstrating the principles explained here, I also provide a few MP3 files that start and end at the same amplitudes but use the different methods in between. (Make sure to disable any fancy audio processing on the playback device you are using to listen to these files.)
About Frequency Controls and Analysis
This is somewhat less of an issue, because few applications have to deal with frequencies at the user end. However, a similar story holds for those that do, but with a slight difference. The human sensation of ‘tone’ is also far from linear but it is not exactly exponential either. At the lowest frequencies it is more linear, while at higher frequencies it is exponential. As overall approximation however, an exponential curve is much better than a linear curve. So please, no linear frequency controls either! You would not want to listen to a piano tuned to a linear scale.
This does not only apply to sound generation but also sound analysis. If you want to create a spectral analysis, the graph should have a logarithmic scale (on both axes, frequency and amplitude) unless there are specific reasons to use a linear scale. With a linear frequency scale all low frequencies will be squeezed into a few lines while the high frequencies will be smeared over a wide area. Mind that even though the audible sound range reaches until 20kHz, “high frequencies” already start at ±2kHz! The most interesting stuff in music happens below 2 kHz. For speech, you can't do much with frequencies above 4kHz (that's why telephones filter these out). Yet these would occupy 80% of a linear spectrogram!
Unfortunately it is not easy to generate a spectrum with a logarithmic frequency axis. FFTs are linear and the only way of getting a log scale from an FFT is to warp the output, resulting in poor resolution at the low frequencies and exaggerated resolution at the high frequencies. To counter this, one could take a resolution so high that it is accurate enough even at the lowest frequencies. That will however result in poor temporal resolution at high frequencies. There is no such thing as a variation on the FFT which produces a log scale right away, but other approaches can be used, for instance a filter bank with filters whose bandwidth increases with frequency. The only problem with that approach is that the time interval of the lower frequency filters needs to be longer than the higher frequencies, which makes it difficult to provide a unified frequency response at any given time.
(1): A funny example of this is the BBC video player that was embedded in news article pages around the year 2012. It had a Spinal Tap-inspired volume slider that goes all the way up to eleven
but because it is linear, the difference between 10 and 11 is completely unnoticeable. There is hardly even any perceivable increase in volume between 8 and 11.
(2): This equation may not be strictly mathematically correct, but it is sufficiently valid for all intents and purposes in this text.
(3): Of course no attribution is needed when making your own implementation of a volume control according to this article. The license only applies to the text itself and the demo scripts.