Testing Fairness of a 100-sided Zocchihedron Die
… after a mere 20 years of collecting throws
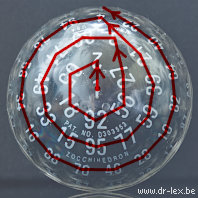
Back in 2005, I bought a 100-sided Gamescience “Zocchihedron” die, mostly out of curiosity after encountering it in a list of commercially available dice. According to the Wikipedia article, the first iteration of the die had been proven not to offer a fair uniform distribution through an experiment published in White Dwarf magazine.
Obviously that experiment must have dated from shortly after the die was introduced in 1985, and was nowhere to be found on the Internet. Moreover, it had been conducted on the first version of the die, hence I had the silly idea of repeating the experiment with a newer edition of the Zocchihedron.
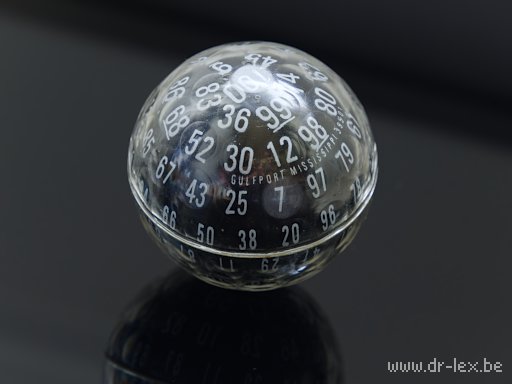
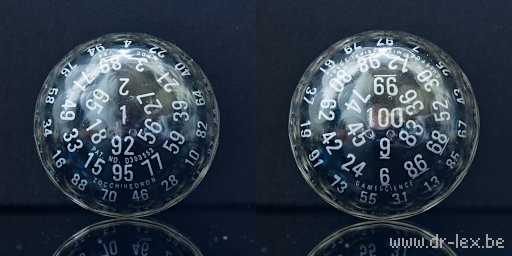
There are multiple versions of the Zocchihedron, as documented on DiceCollector.com. Based on that information, my particular die must be either a Mk I.II or a Mk III. Given the fact that it produces a distinct rattling sound that seems more like plastic beads than sand, I am almost certain this must be a Mk I.II.
However, it is not essential to know which exact edition of the die I have been testing, because it is obvious that no matter how hard the design is tweaked, it will never have a perfect uniform distribution. Unlike a d10, d12, or d20, which are based on shapes that inherently have evenly distributed identical faces, the Zocchihedron is basically a sphere with circular flat faces embedded into it through a best-effort spacing, which earns it the “golfball” nickname.
It is impossible to distribute 100 identically shaped faces onto a sphere in a perfectly radially distributed symmetrical way. On the Zocchihedron, the faces are arranged in 8 rows with 2 extra faces at the top and bottom (the numbers 1 and 100). Inevitably, there are still segments of the original spherical shape in between the faces, and these segments have various shapes and sizes. This will lead to non-uniform behaviour, but the question is of course how large the effect will be.
The Data
I have been rolling this die since 2006 at various moments, collecting the data in a text file. I did this whenever I had to wait for something, or just whenever I felt the need for some mindless activity. There have been long periods during which I basically forgot about this, which leads to it taking a total of 20 years to collect a sufficient number of throws for a decent statistical evaluation. The COVID pandemic was probably the most productive, as it was the era of many less-than-productive video meetings, during which it was rather easy to be rolling the die and collecting numbers without anyone noticing. I finally reached 5150 throws in April 2026, roughly the same number as the 5164 used in the White Dwarf experiment.
I have tried to always perform the rolls on a nearly perfectly level surface, avoiding that the die would come to a halt by colliding with something. The types of surfaces used varied, with the majority of the rolls performed on a hard plastic mat. I have tried to sufficiently shake and roll the die in between throws.
The text file with the raw throws can be obtained from the Random Archive, where it has lived for the past 20 years. Just like this article, I release the data under a Creative Commons Attribution License.
Analysis
The 5150 throws have a mean of 50.95 and a standard deviation of 27.98.
(If the distribution would have been perfectly uniform, those values would have been 50.5 and 28.87.)
The standard test for fairness of a die is Pearson's chi-squared test. Given our 5150 throws, we expect each of the 100 faces to appear 51.5 times on average. For the math nerds, the statistic to be calculated is:
With Oi the observed count for face i, and Ei = 51.5 for all faces.
This can be calculated with a simple Python script relying on scipy. The result is a χ2 statistic of 554.6 for a p-value way below 0.001, hence we can pretty confidently say that this die is unfair.
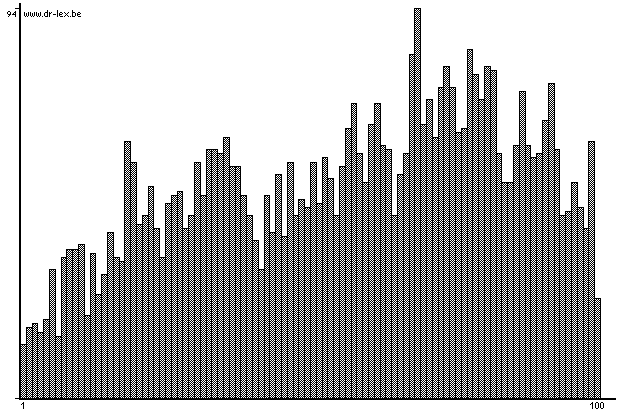
The actual distribution can be made visible by plotting the histogram of every face's occurrence. The Python script will also output the occurrence frequencies, together with an ASCII art histogram. Plotted through my ancient tool made in Hypercard back in 2006, the histogram looks like this:
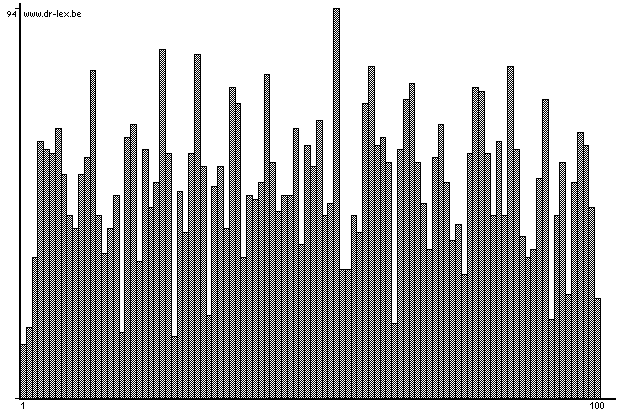
This histogram clearly shows that the first and last values, i.e., 1 and 100, occur much less often than the others. This makes sense when placing the die on a flat surface and trying to bump it such that it will go from nearly one of those positions towards the position itself. This is harder for those 2 particular faces than for most of the others, I assume because there is less of the original spherical shape around the numbers 1 and 100 than around most of the other faces. This leads to a more prominent edge around those two faces, making it harder for the die to spontaneously roll towards them.
There are some other numbers unlikely to occur, like 18 and 27, as well as some that show up suspiciously often, like 55 and 25.
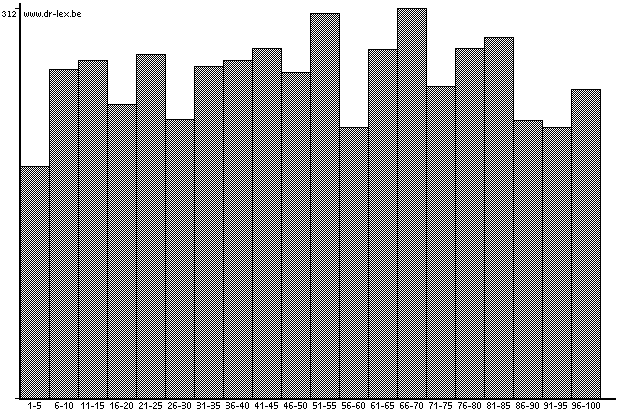
Overall, if there is no need for perfect uniformity across all numbers, this histogram shows that there is no obvious bias towards high or low numbers or a particular range of numbers. However, even when treating the Zocchihedron as an overly complicated d20 by binning the throws per 5 values, the distribution still looks somewhat uneven:
Checking for unbalance
Things get more interesting when remapping the values such that they are more sequential according to their positioning on the die. I started out at 1, and then went in a counter-clockwise spiral until I ended up at 100 at the other side. Mind that this will be different for the very first edition of the Zocchihedron, as well as for the latest edition which again uses a different arrangement of the numbers.
The resulting mapping is as follows, also available in the above Python script:
1 2 65 18 92 56 27 3 89 71 49 33 15 95 77 59 39 21 4 94 76 58 34 16 88 70 46 28 10 82 64 40 22 5 81 63 51 35 17 93 75 57 47 29 11 87 69 53 41 23 44 54 72 90 14 32 48 60 78 96 20 38 50 66 84 8 26 31 55 73 91 19 37 61 79 97 7 25 43 67 85 13 6 24 42 62 80 98 12 30 52 68 86 9 45 74 99 36 83 100
Plotting the histogram using these somewhat sequentially remapped values, yields this result:
This reveals an obvious unbalance in this particular die, with the zone around 55 being the lightest. It also shows that all faces bordering on the 1 face have a considerably lower chance of occurring as well.
I cannot tell whether other dice will have the same unbalance, or the “hot spot” will vary per die, or this is just a manufacturing problem with this particular die. The only way to test this, is obviously to buy more of these dice and again throw each of them a few 1000 times, but I will not be the one to do that. Maybe someone can build a robot for this and make an interesting YouTube video about it!
One thing I noticed while recording the list of throws, is that within each group of 3 throws, the likelihood of the first and third being identical seems unusually high, but I have not checked this on the data.
One remarkable thing I also noted down: at throw 5049, there has been one case of the die not settling on any face, but on one of the spherical segments in between faces—a bit like a coin landing on its side!
Conclusion
The Zocchihedron is a nice curiosity and perhaps a must-have for collectors of unusual dice, but it has several problems to be a practical game die.
Next to the well-known usability problems of taking long to settle and being hard to read, the concept of cramming 100 flat faces into a sphere is inherently unable to offer a perfect uniform distribution of throws. Moreover, as my experiment has shown, dice may have a bias towards one side, causing certain numbers to be highly favoured. The way in which the numbers are spread, somewhat helps with flattening the overall distribution when exact values are less important, but a well-manufactured d20 would be a better choice in that case.
When a reliable uniform distribution of values between 1 and 100 is needed, I would recommend to simply use two d10 throws, or 2 differently colored d10s to get the result in a single throw.
If you really want to use the Zocchihedron and improve its randomness, I would recommend to:
- provide obstacles for it to bounce against, for instance use a dice tower with a closed tray;
- use a somewhat uneven surface;
- shake it well between throws.